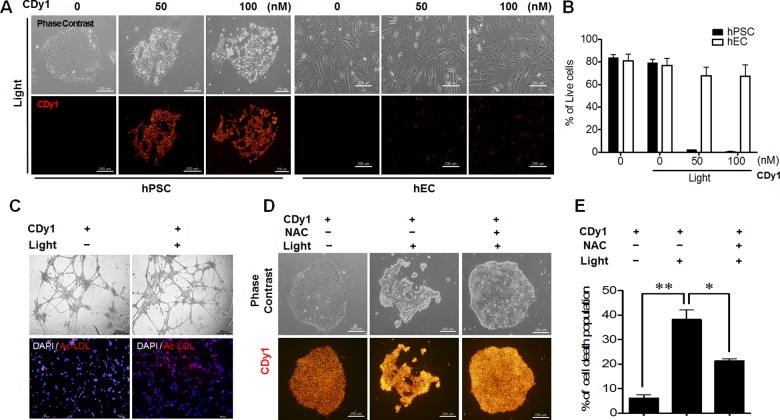
Figure 2.
(A) CDy1-stained or nonstained hPSC (left) and hEC (right) exposed to 1.2 W/cm2 of green light (532 nm), 1 min (scale bar, 200 μm). CDy1 treated from zero to 100 nM concentration. (B) Live cell quantification by dual negative population of annexin V and 7-AAD after 5 h of 1 min irradiation. Mock are cells without CDy1 and irradiation. (C) Tubule formation (upper) and acetylated low-density lipoprotein (Ac-LDL, red) uptake assay of hEC 24 h after 1 min light exposure (scale bars, 100 μm). The results represent one of the experiments performed in triplicate. DAPI (blue) for nuclear counterstaining. (D) CDy1-stained hPSC were pretreated with 3 mM of NAC for 1 h prior to the light exposure. (E) Quantitative analysis data of cell death for images in panel D by annexin V staining.

