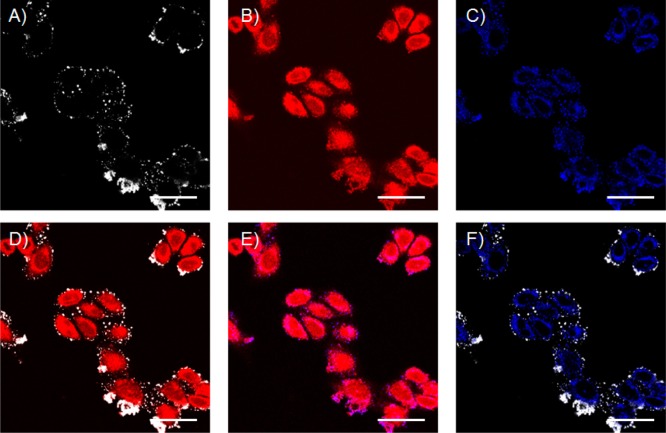
Figure 4.
Visualization of endosomes using an endosome tracker. CHO cells were treated with CPK for 2 h, followed by coincubation with pHrodo red dextran and CPE-decorated liposomes (0.25 mM total lipid concentration and 1 mol % CPE) loaded with TOPRO 3. (A) White channel showing DOPE-NBD liposomes. (B) Red channel (TOPRO3). (C) Blue channel (pHrodo). (D) Overlay of panels A and B. (E) Overlay of panels B and C. (F) Overlay of panels A and C. Scale bar is 25 μm.

