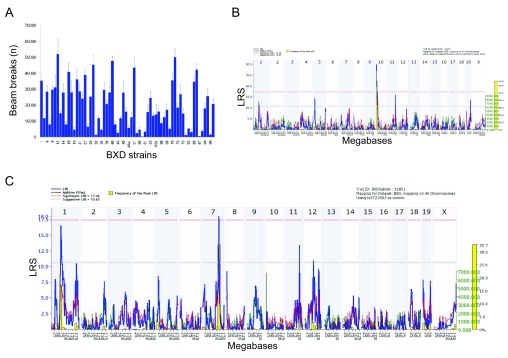
Figure 1.
( A) Trait data for locomotion (number of beam breaks as a measure of distance traveled) for 64 BXD strains post morphine injection (Trait id 11851). ( B) Whole genome scan showing a robust QTL on Chromosome 10 (Trait id 11851, SNP rs372180). The x-axis represents chromosome number and megabase position and the y-axis represents the likelihood ratio statistic (LRS) of linkage. Blue lines indicate LRS across the genome. The pink and gray horizontal lines are approximate threshold values which are used to assess whether a peak is significant (P<0.05) or suggestive (P<0.63), respectively. Red and green lines represent the additive genetic contribution: red lines indicate negative values (C57BL/6J alleles increasing trait values) and green lines indicate positive values (DBA/2J alleles increasing trait values). Gray lines are shown when the parental strain is unknown. The yellow bars represent the relative frequency of peak LRS at a given location from 2000 bootstrap resamples ( C) Composite interval mapping of locomotion (Trait id 11851) after correcting for the peak on Chromosome 10 reveals a significant QTL on Chromosome 7.

