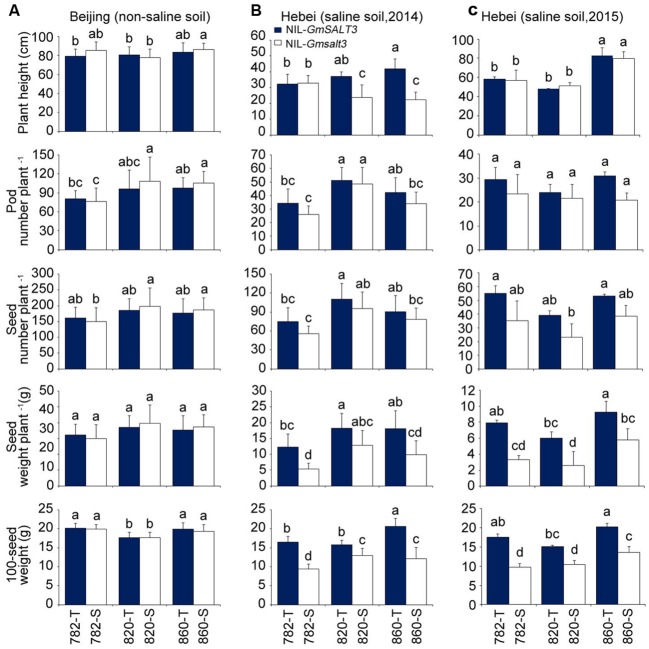
FIGURE 6.
Yield related traits comparison for three sets of NILs grown in saline and non-saline soil conditions. (A) Plant height, pod number per plant, seed number per plant, seed weight per plant and 100-seed weight of three sets of NILs grown in non-saline soil (Shunyi, Beijing). Data are means of three replicates consisting of mean data from 15 plants per replicate ± SD (n = 3). (B) Plant height, pod number per plant, seed number per plant, seed weight per plant and 100-seed weight of three sets of NILs grown in saline soil (Tanghai, Hebei province, 2014). (C) Plant height, pod number per plant, seed number per plant, seed weight per plant and 100-seed weight of three sets of NILs grown in saline soil (Tanghai, Hebei province, 2015). Data are means of three replicates consisting of mean data from 15 plants per replicate ± SD (n = 3). Different letters indicate statistically significant differences between NIL lines (one-way ANOVA followed by Tukey’s HSD post hoc test, P < 0.05).

