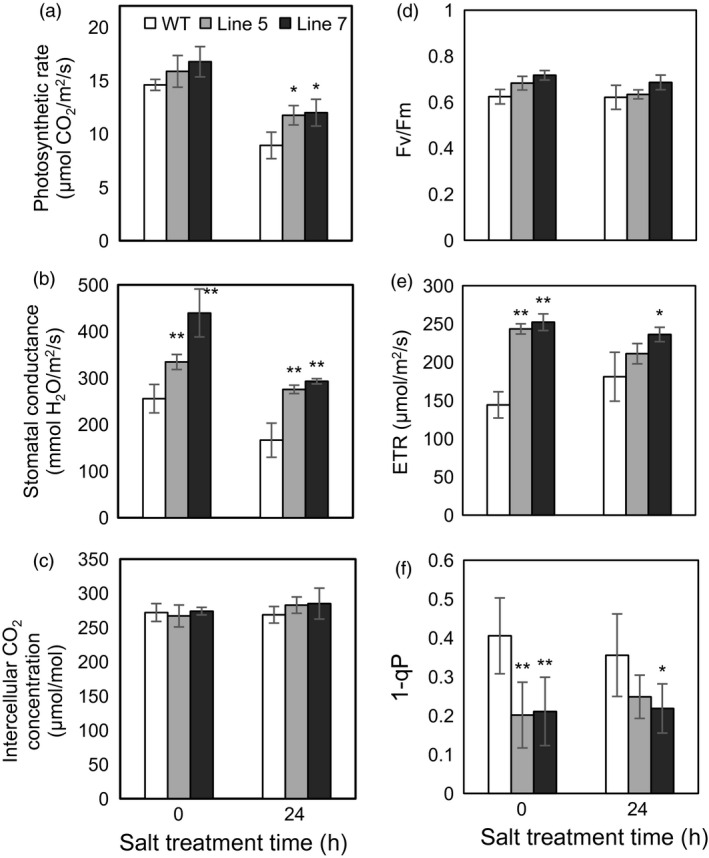
Figure 6.

Changes of the photosynthetic rate (a), stomatal conductance (b), intercellular CO 2 concentration (c), maximum quantum yield of PSII (F v/F m) (d), photosynthetic electron transport rate (ETR) (e), and PSII excitation pressure (1−qP) (f) in the leaves of the wild‐type (WT) and transgenic plants at 0 and 24 h after 50‐mm NaCl treatment. Data are presented as means ± SD (n = 3). *Significant difference, P < 0.05; **highly significant difference, P < 0.01.
