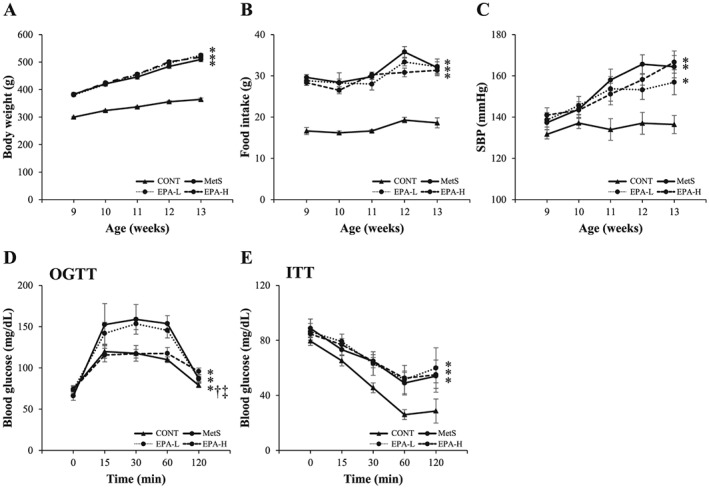
Figure 1.

Age‐dependent changes in body weight (A), food intake (B) and systolic blood pressure (SBP) (C) as well as oral glucose tolerance test (OGTT) (D) and insulin tolerance test (ITT) (E) assays performed at 13 weeks of age for rats in the four experimental groups. Data are means ± standard error of the mean (n = 10, 10, 11 and 11 for control [CONT], metabolic syndrome [MetS], low‐dose eicosapentaenoic acid [EPA‐L] and high‐dose eicosapentaenoic acid [EPA‐H] groups, respectively). *P < 0.05 vs. CONT; †P < 0.05 vs. MetS; ‡P < 0.05 vs. EPA‐L.
