Figure 5.

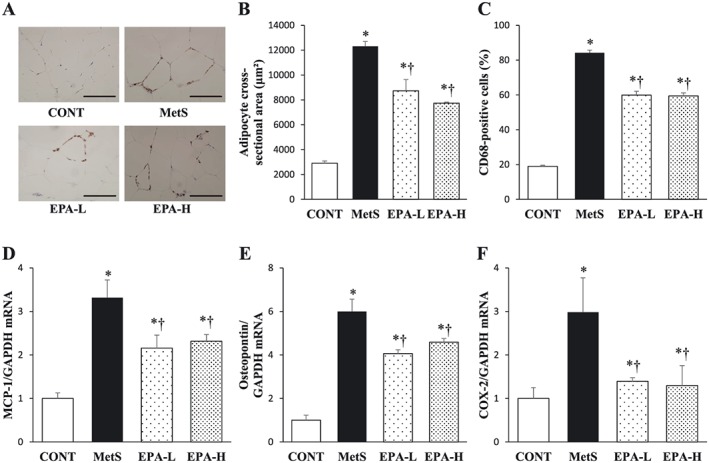
Retroperitoneal adipose tissue inflammation in rats of the four experimental groups at 13 weeks of age. (A) Immunohistochemical staining for the monocyte–macrophage marker CD68. Scale bars, 100 µm. (B) Cross‐sectional area of adipocytes determined from sections similar to those in (A). (C) The number of nuclei for CD68‐positive cells as a percentage of total nuclei as determined from sections similar to those in (A). (D–F) Quantitative reverse transcription‐polymerase chain reaction analysis of monocyte chemoattractant protein‐1 (MCP‐1), osteopontin and cyclooxygenase‐2 (COX‐2) mRNAs, respectively. The amount of each mRNA was normalized by that of glyceraldehyde‐3‐phosphate dehydrogenase (GAPDH) mRNA and then expressed relative to the mean value for the control (CONT) group. All quantitative data are means ± standard error of the mean (n = 10, 10, 11 and 11 for CONT, metabolic syndrome [MetS], low‐dose eicosapentaenoic acid [EPA‐L] and high‐dose eicosapentaenoic acid [EPA‐H] groups, respectively). *P < 0.05 vs. CONT; †P < 0.05 vs. MetS.
