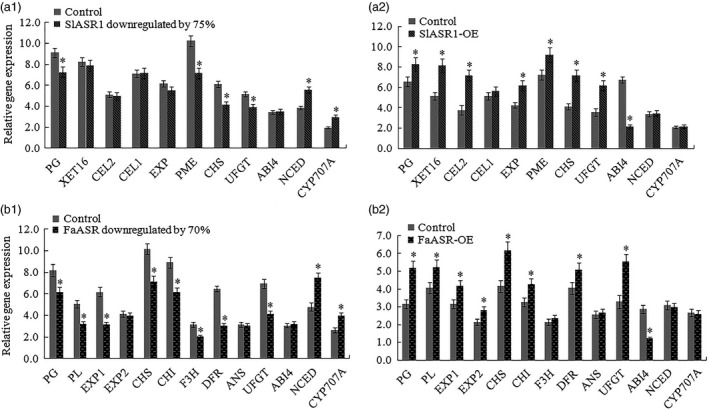
Figure 12.

qRT‐PCR analysis of anthocyanin and cell wall metabolism genes. (a) Detection of anthocyanin and cell wall metabolism genes expression levels in the SlASR1 silencing (a1) or overexpression (a2) tomato fruit and their corresponding control. SlSAND gene was used as an internal control. (b) In the strawberry, the cell wall metabolism genes and anthocyanin metabolism genes were analysed in the FaASR gene silencing (b1) and overexpression (b2) fruits, and their corresponding control. FaActin gene was used as the internal control. Vertical bars represented standard deviations (SD) of means (n = 3). Asterisks indicated statistically significant differences at P < 0.05 as determined by Student's t‐test.
