Fig. 1.

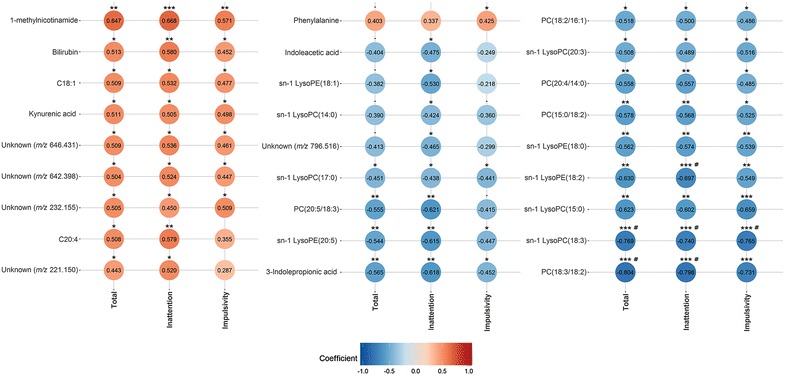
Correlation plot between metabolites and ADHD-like behavioural scores. Red and blue circles indicate positive and negative correlations, respectively. *praw < 0.05, **praw < 0.01, ***praw < 0.001, #pFDR < 0.05

Correlation plot between metabolites and ADHD-like behavioural scores. Red and blue circles indicate positive and negative correlations, respectively. *praw < 0.05, **praw < 0.01, ***praw < 0.001, #pFDR < 0.05