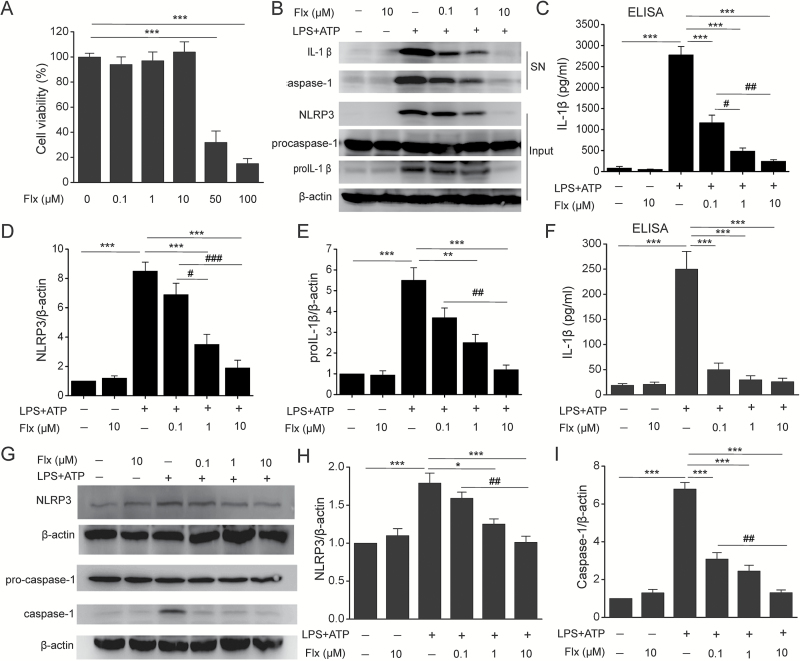
Figure 1.
Fluoxetine inhibited NLRP3 inflammasome activation in bone marrow-derived macrophages (BMDMs) and RAW264.7 macrophages. BMDMs and RAW264.7 macrophages were incubated with indicated concentrations of fluoxetine (Flx, 0.1 μM, 1 μM, 10 μM) for 1 hour, then stimulated with LPS (100ng/mL) followed by 30 minutes of ATP (5mM) treatment. (A) The cytotoxicity of fluoxetine (Flx, 0.1 μM, 1 μM, 10 μM, 50 μM, 100 μM) was measured by 3-[4,5-dimethylthiazol-2-yl] -2,5-diphenyltetrazolium bromide (MTT) assay (*** P<.001 vs Flx 0 μM). There were no significant differences among Flx 0 μM, Flx 0.1 μM, Flx 1 μM, and Flx 10 μM groups. (B) Immunoblot analysis of interleukin (IL)-1β and cleaved caspase-1 (p20) in culture supernatants (SN) of BMDMs and immunoblot analysis of the NLRP3, proIL-1β, and procaspase-1 in lysates of those cells (input). (C) ELISA of IL-1β in supernatants of BMDMs. (D-E) Quantitative analysis of NLRP3 (D) and proIL-1β (E) in BMDMs. (F) ELISA of IL-1β secretion in supernatants of RAW264.7 macrophages. (G-I) Representative immunoblots (G) and quantitative analysis of NLRP3 (H) and caspase-1 (I) in RAW264.7 macrophages. Data are represented as means ± SEM from 2 replicates in 3 independent experiments. * P<.05, ** P<.01, *** P<.001 vs LPS+ATP; # P<.05, ## P<.01, ### P<.001 vs LPS+ATP+Flx 0.1 μM. There were no significant differences between -LPS-ATP and -LPS-ATP + Flx 10 μM.

