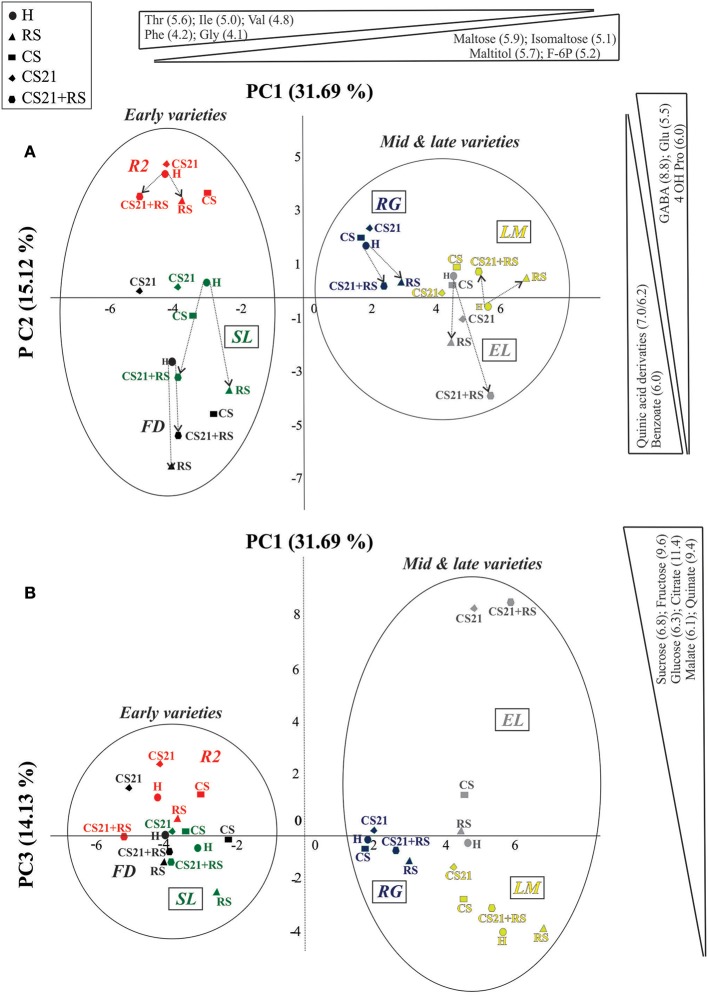
Figure 4.
Principal component analysis (PCA) of the metabolic profile of peach fruit varieties subjected to different postharvest treatments. Metabolic profile of peach fruit samples from six varieties (FD, R2, SL, RG, EL, and LM) subjected to different postharvest treatments (H, RS, CS, CS21, and CS21+RS) was analyzed by PCA. The first principal component (PC1) is shown on the x-axis vs. the second principal component (PC2) on the y-axis in (A); and vs. the third principal component (PC3) on the y-axis in (B). Early and mid & late varieties, which are clearly separated by PC1, are indicated with circles. The metabolites that contribute the most to each component separations are indicated on the top (PC1) and on the right (PC2 in A and PC3 in B). The variance explained by each component (%) is indicated in parentheses. In (A), the path from H to ripened fruits (RS and CS21+RS) is indicated by arrows. Resistant to mealiness varieties (LM, SL, RG, and EL, Table 1) are marked with a rectangle.

