Figure 5.
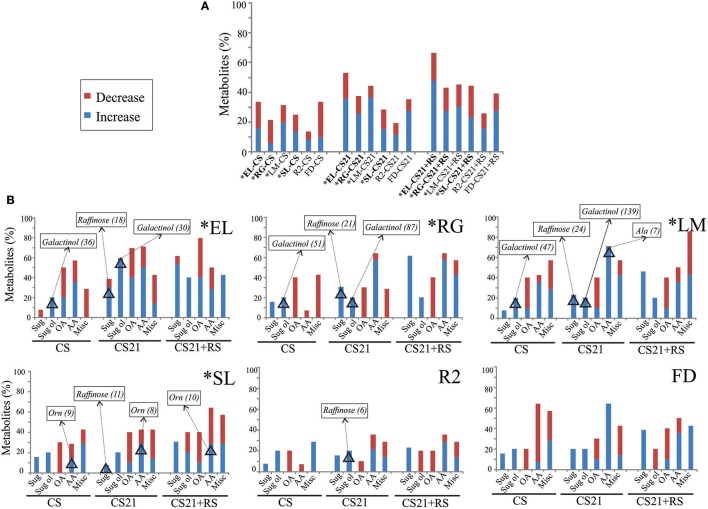
Effect of cold-treatments on the metabolome of peach fruits from different varieties. (A) For each peach fruit variety (EL, RG, LM, SL, R2, and FD), metabolite levels in CS, CS21, and CS21+RS samples were compared with those detected at H, and the % of metabolites that are significantly increased or decreased are shown. (B) For each variety (EL, RG, LM, SL, R2, and FD), the % of sugars (Sug), sugars alcohol (Sug ol), organic acids (OA), amino acids (AA), and miscellaneous compounds (Misc); that are significantly increased or decreased in CS, CS21, and CS21+RS samples relative to H are shown. In each graph, the metabolites that resulted modified more than 5 times are shown in rectangles, followed by the ratio of modification relative to H in parenthesis. The metabolites that are modified from or to not detectable levels are not highlighted in this graph, but they were considered in the number of metabolites that are increased or decreased. The asterisk denotes varieties that are resistant to chilling injury (Table 1). The relative metabolite levels of each peach sample are shown in Supplemental Table 4.

