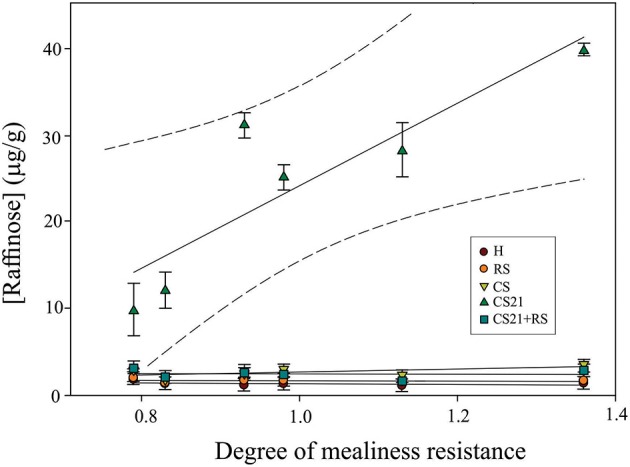
Figure 6.

Linear regression line fit between the degree of mealiness resistance and raffinose concentration at harvest and after different postharvest treatments of peach fruit. Multiple regression analysis was performed between raffinose concentration at H; RS; CS; CS21; or CS21+RS, and the degree of mealiness resistance of the six peach varieties (Table 1). The following regression coefficients were obtained for each postharvest condition: H (R2 = 0.13); RS (R2 = 0.038); CS (R2 = 0.35); CS21 (R2 = 0.78); and CS21+RS (R2 = 0.0053). The 95% confident intervals are indicated in the case of CS21.
