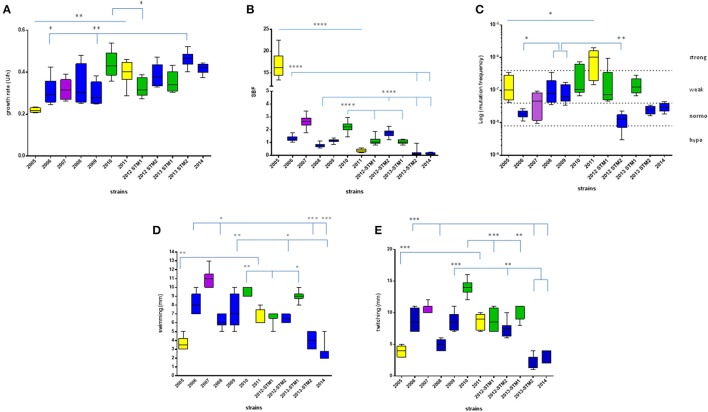
Figure 2.
Phenotypic traits exhibited by S. maltophilia strains. Colors indicate the pulsotypes: 1.1 (yellow, n = 2 strains), 1.2 (green, n = 3 strains), 2.1 (blue, n = 6 strains), and 2.2 (purple, n = 1 strain). (A) Growth rate, expressed as generation time (U/h). (B) Biofilm biomass formation, normalized on growth rate and expressed as specific biofilm formation (SBF) index. (C) Mutation frequency; strains were classified into four categories based on mutation frequency (f): hypo-mutators (f ≤ 8 × 10⁻⁹), normo-mutators (8 × 10⁻⁹ < f < 4 × 10⁻⁸), weak-mutators (4 × 10⁻⁸ ≤ f < 4 × 10⁻⁷), and strong-mutators (f ≥ 4 × 10⁻⁷). (D) Swimming motility, expressed as diameter of growth zone (mm). (E) Twitching motility, expressed as diameter of twitch zone (mm). Results are shown as box and whiskers (n = 6, for each strain): the box always extends from the 25th to 75th percentiles, while the line in the middle of the box is plotted at the median. Statistical analysis: *p < 0.05, **p < 0.01, ***p < 0.001, ****p < 0.0001, Mann–Whitney-test (pulsotype 1.1) or Kruskal–Wallis followed by Dunn's multiple comparison post-test (pulsotypes 1.2 and 2.1).

