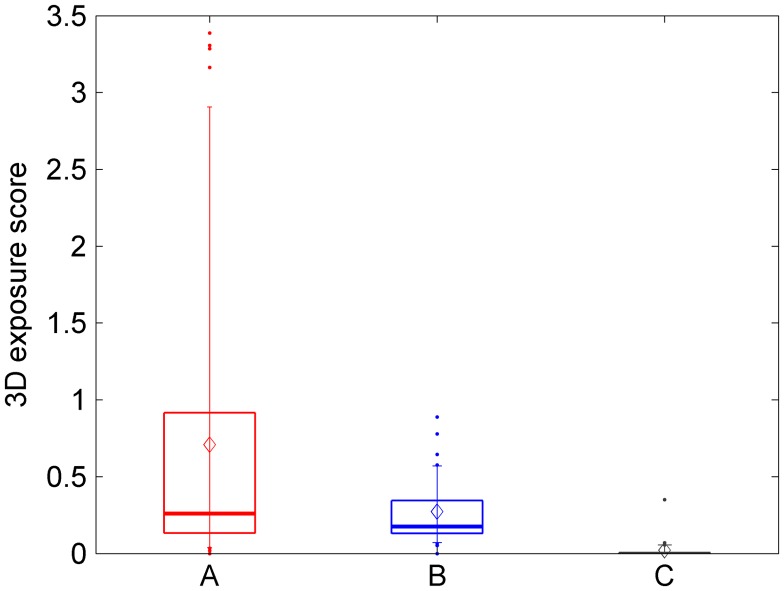
Figure 2.
S3D exposure prior to study. Box and whisker plot for S3D exposure score (see Methods), for each of the 3 TV-groups specified in Table 1.
Notes: Thick lines show the median; diamonds show the mean; boxes run from 25 to 75% percentile; whiskers run from 9 to 91% percentile; dots show individual data-points outside these limits. The minimum score in each group was 0 (no 3D content viewed); the maximum was 3.4 for A-group, 0.9 for B and 0.4 for C; the medians were 0.26, 0.18, and 0 respectively.

