
FIGURE 4.
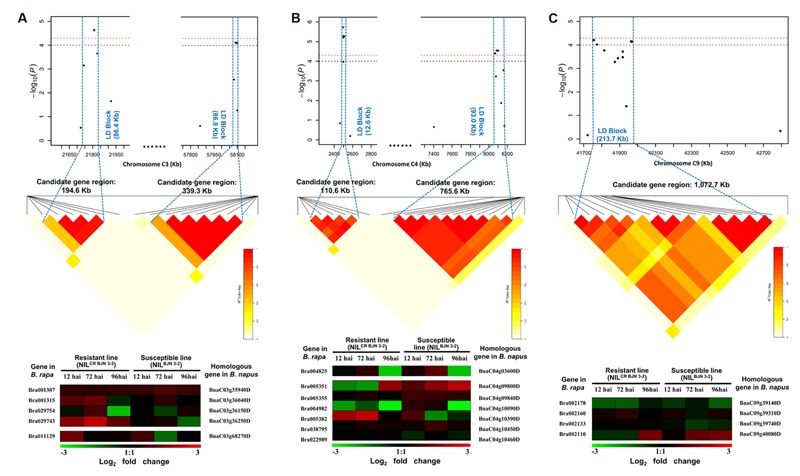
The candidate regions and predicting candidate genes for part of quantitative trait loci (QTL) identified in this study. (A) The candidate regions and predicting candidate genes for MCR-C3 and SCR-C3. (B) The candidate regions and predicting candidate genes for SCR-C4a and SCR-C4b. (C) The candidate regions and predicting candidate genes for MCR-C9. Haplotype block in strong LD (r2 > 0.4) with the most significant associated SNPs are shown between the blue dashed line. The chromosome region between the two flanking markers of the LD block is defined as candidate gene region for each QTL. Heat maps of the differentially expressed genes (DEGs) from transcriptome data of B. rapa, which were performed by Chen et al. (2015), the shade of color represent the log2 fold changes (inoculated/mock-inoculated) of the DEGs from B. rapa. The genes at the left of heat maps are the DEGs in B. rapa, and the genes at the right of heat maps are the homoeologous genes of DEGs from B. rapa in B. napus.