An official website of the United States government
Here's how you know
Official websites use .gov
A
.gov website belongs to an official
government organization in the United States.
Secure .gov websites use HTTPS
A lock (
) or https:// means you've safely
connected to the .gov website. Share sensitive
information only on official, secure websites.
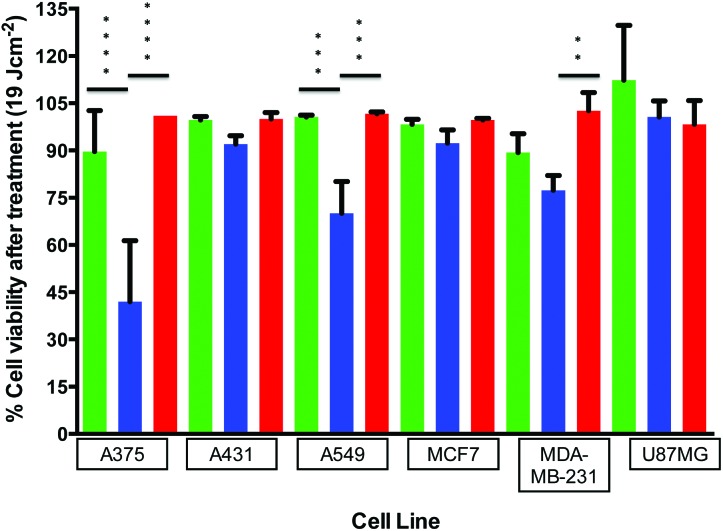
 ), green (520 nm, 15 min,
  ), or red (630 nm, 9 min,
  ) light. Averages of the cell viability percentages (blue and green irradiated or blue and red irradiated) were analyzed using a one-way ANOVA. **p = 0.005, ***p = 0.0005, ****p < 0.0001.