Fig. 3.
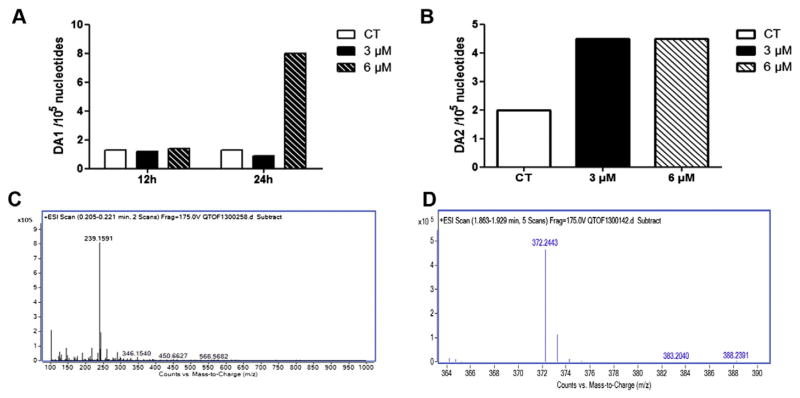
PM exposure induces DNA adduct formation. SIGCs were treated with DMSO or PM (3 or 6 μM) for 12, 24 or 48 h for DNA isolation. Agilent QTOF6540 liquid chromatography (LC) mass spectrometry (MS) analysis was performed to detect DA1 and DA2 formation. Internal standards of DA1 and DA2 were prepared according to a modified procedure (Hemminki, 1985; Malayappan et al., 2010). Values represent the relative abundance of DNA adducts (1 × 10⁵ nucleotides). (A) Quantification of DA1 appearance: DA1 was observed after 24 h of exposure to 6 μM PM. (B) Quantification of DA2 appearance: DA2 was formed after 48 h at both the 3 and 6 μM concentrations. (C) LC/MS spectrum indicating the DA1 product of 239 m. wt. (D) LC/MS spectrum indicating the DA2 product of 372 m. wt.

