Fig. 4.
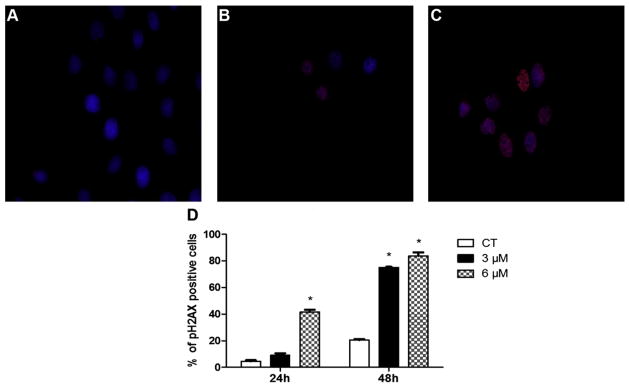
DNA damage was induced by PM exposure as determined by localization of γH2AX. SIGCs were treated with (A) DMSO, (B) 3 μM PM or (C) 6 μM PM for 24 or 48 h and γH2AX protein localized using immunofluorescence staining (A–C). Blue represents DAPI nuclear stain; red staining indicates a FITC labeled primary antibody against γH2AX protein. (D) Values represent % of γH2AX positive cells (out of a total of ~150 cells per slide) ± SE; n = 3 per treatment/timepoint. Different letters indicate difference from CT; P < 0.05. γH2AX protein appearance indicates DNA DSB formation, which was subsequent to DNA adduct detection.

