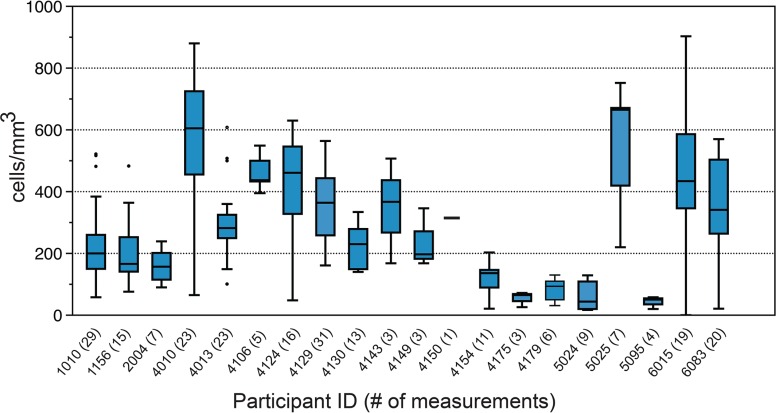
FIG 2.
Available CD4+ cell measurements for study participants. Box-and-whisker plots show the Nadir (lowest value), median, range and highest CD4+ measurements available for each patient in cells/mm3. Participant identifiers are on the x axis, followed by the number of available CD4+ measurements in parentheses.

