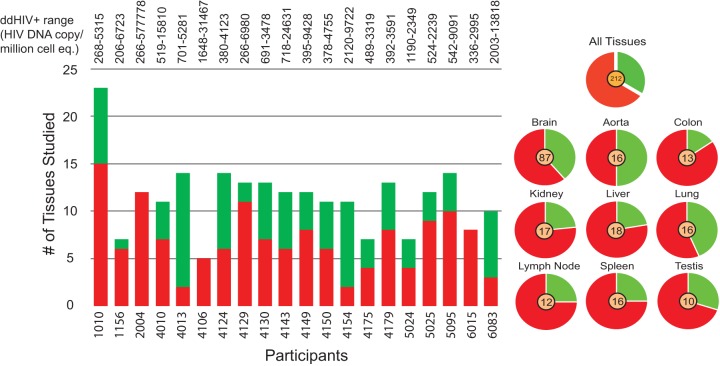
FIG 6.
HIV positivity in cohort autopsy tissues. For each participant, the graph on the left shows the number of tissues assayed along with the number of HIV+ (red) and HIV− (green) tissues identified. On the right, a pie chart is shown for each major tissue assayed for the presence of HIV in the cohort, with the total number of cohort tissues assayed shown in the center.

