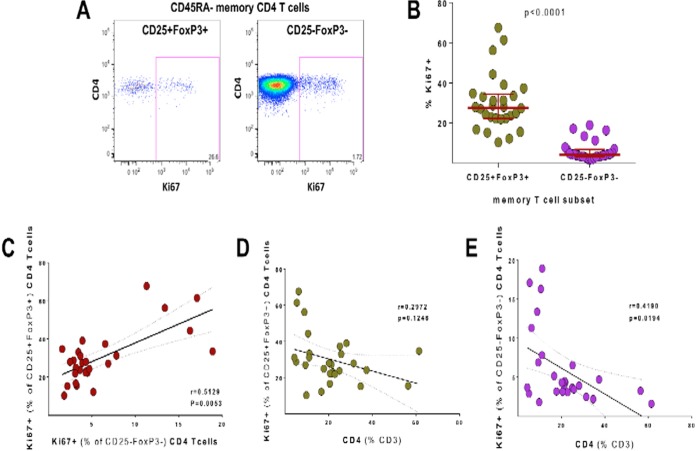
FIG 3.
Ki67 expression in CD25+ FoxP3+ and CD25− FoxP3− memory CD4 T cells in HIV+ subjects. (A) Representative dot plots for Ki67 staining. (B) Comparison of the frequencies of Ki67+ cells in CD25+ FoxP3+ and CD25− FoxP3− memory CD4 T cells in HIV+ subjects. (C) Correlation analysis of the frequency of Ki67+ cells between CD25+ FoxP3+ (y axis) and CD25− FoxP3− (x axis) memory CD4 T cells. (D and E) Correlation analysis of the frequency of Ki67+ cells among CD25+ FoxP3+ (D) and CD25− FoxP3− (E) CD4 T cells versus CD4 T cell frequencies (% of CD3). The analysis was done using cryopreserved PBMC samples from HIV+ HHECO study participants. Memory status of CD4 T cells was determined by CD45RA staining. Statistical analysis was performed using the Mann-Whitney test for comparison of groups and the Spearman r statistical test for correlation analyses.

