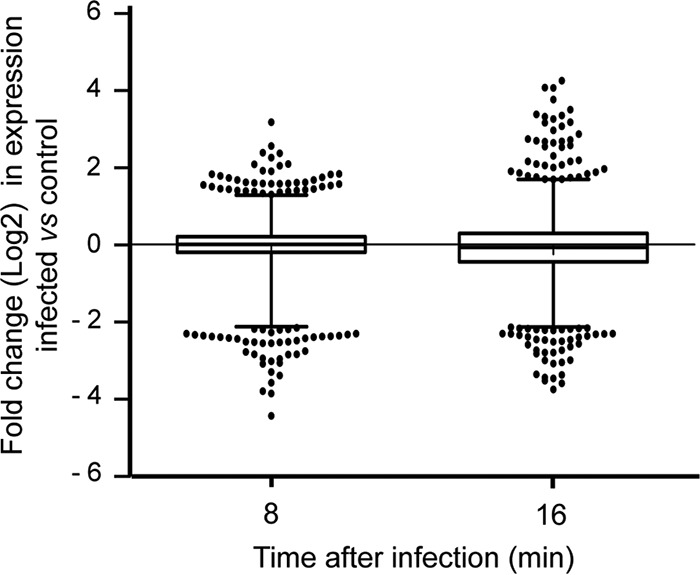
FIG 3.

Box-and-whisker plots showing the relative fold change (log2) in the expression of B. subtilis genes after 8 or 16 min of ϕ29 infection compared to uninfected controls. The analysis considered 4,421 genes of B. subtilis. Each box represents the differential expression values from the lower to the upper quartile (corresponding to the 25 to 75% of the data set). The middle horizontal line represents the median. The whiskers extend from the boxes to 1 and 99% of the data set. Dots indicate outliers. Each data point represents the mean of two independent experiments.
