
FIG 4.
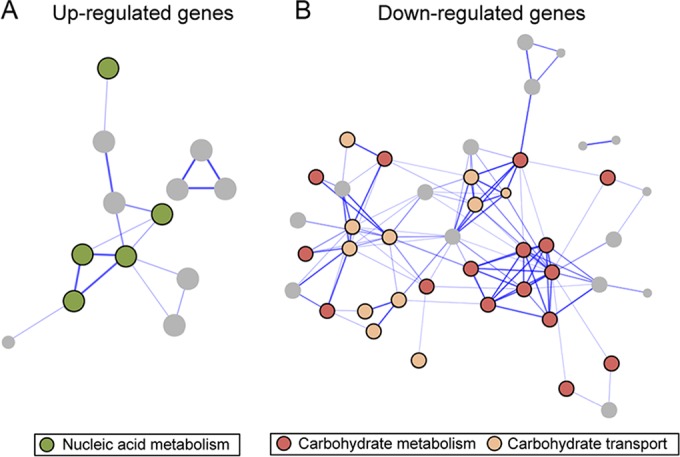
Interaction networks of the B. subtilis proteins encoded by genes that are upregulated (A) or downregulated (B) after 8 and 16 min of ϕ29 infection obtained from STRING database (v9.1) using default settings (confidence > 0.4). The proteins are represented by nodes, which are colored according to the GO biological process classification (nucleic acid metabolism in green and carbohydrate metabolism and carbohydrate transport in red and beige, respectively). Genes belonging to other GO categories are colored gray. Disconnected nodes are not shown. Lines represent the predicted functional associations between the proteins.