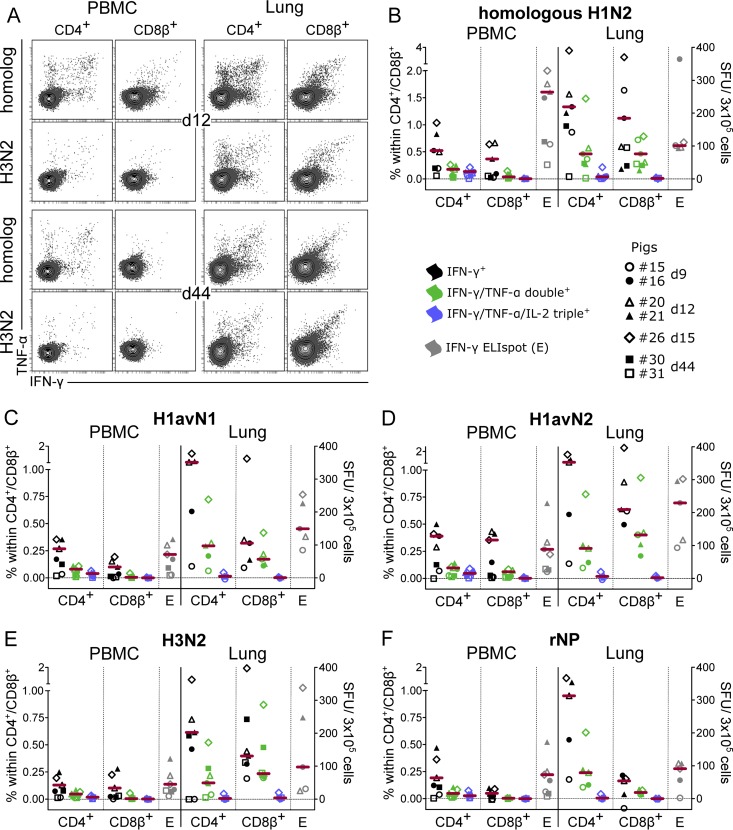
FIG 12.
Cytokine response to restimulation with heterologous influenza A virus and nucleoprotein. For intracellular cytokine staining (ICS) and IFN-γ ELISpot assays, defrosted PBMC and lung cells were restimulated with different influenza virus strains (MOI = 0.3) and recombinant influenza virus nucleoprotein (rNP) (1 μg/ml). Mock-incubated cultures served to determine background production. (A) Contour plots show IFN-γ and TNF-α production of CD4+ (gated on CD4+ CD8β− cells [not shown]) and CD8+ T cells (gated on CD4− CD8β+ cells [not shown]) isolated from blood (PBMC) and lungs of pig 20 (day 12) and pig 30 (day 44). Approximately 50,000 CD4+ or CD8+ T cells are shown in each plot. (B to F) Mock-corrected frequencies of cytokine-defined subsets within CD4+ or CD8+ T cells and mock-corrected spot-forming units (SFU) (IFN-γ ELISpot assay) in response to the indicated influenza virus strains and rNP are shown for 5 to 7 animals. The zero level is indicated by the dashed horizontal line. Due to cell shortage, lung cells from day 44 were tested only by ICS after incubation with homologous H1N2, heterologous H3N2, and respective mock controls. Red bars show the median, excluding values for the last time point (day 44) p.i.

