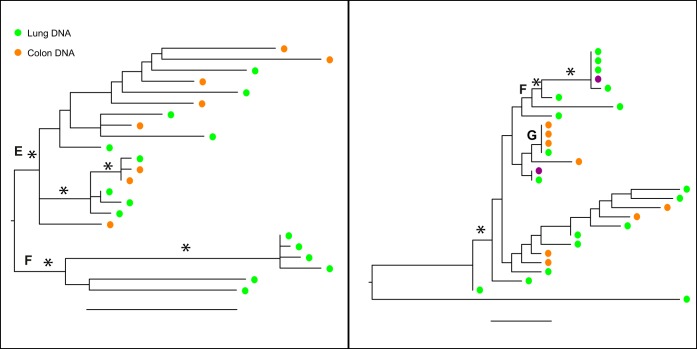
FIG 3.
Maximum-likelihood trees of the env (left) and nef (right) sequences for patient C04. Branches are drawn in substitutions/site according to the scale at the bottom. Circles are colored by the tissue of origin. Open circles, RNA; filled circles, DNA. Asterisks represent branches with support of >70.

