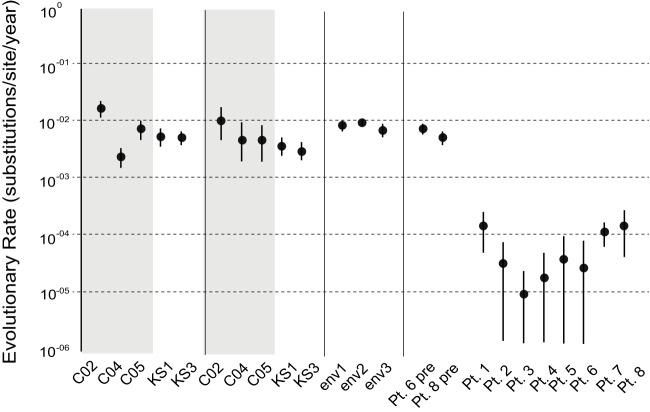
FIG 5.
BEAST estimated evolutionary rates. Mean (circles) and 95% confidence interval (vertical bars) evolutionary rates were estimated for the env and nef regions from the cART-infected and cART-naive patients in this study (C02 to KS3). Also shown are the rates reported in reference 26 (env1); rates for progressors (env2) and nonprogressors (env3) from reference 25; and pretherapy and posttherapy rates from reference 8. The y axis on log scale. Gray boxes indicate estimates from cART-treated patients.

