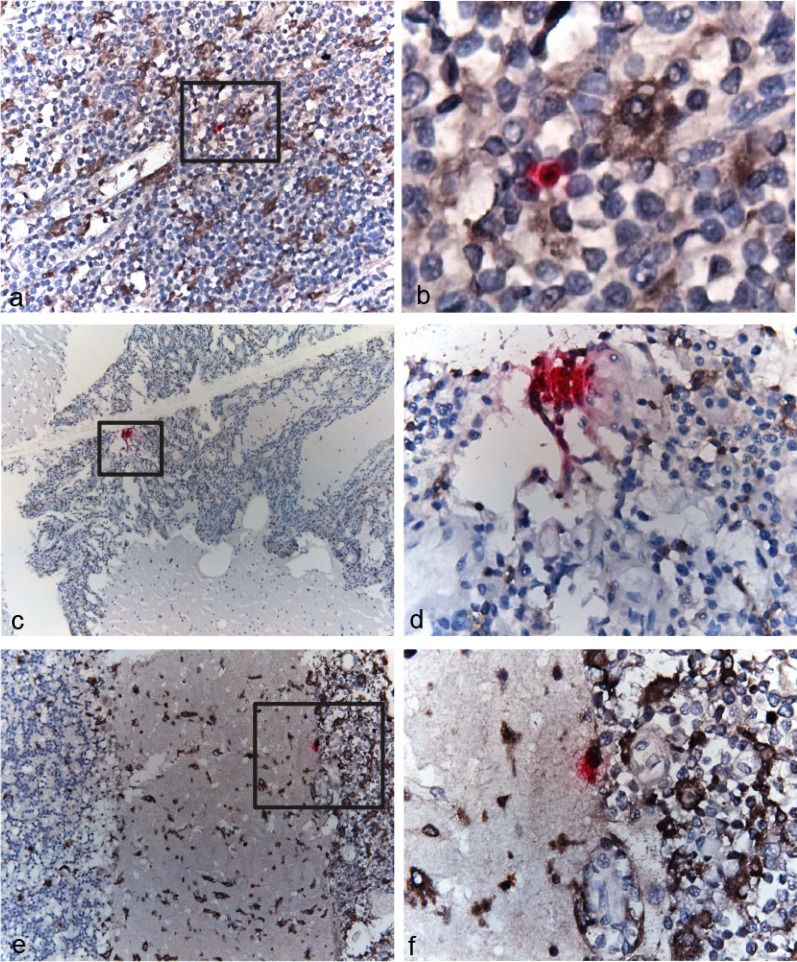
FIG 6.
RNAscope of cells expressing HIV gag-pol transcripts. Each punctum (pink dot) represents a single HIV gag-pol transcript in lymph node tumor (a and b) and cerebellum (c to f). Note that many puncta fuse together and appear as dense red staining of the entire cell. Cells were stained for markers of macrophages (CD68) and their activation/infiltration phenotype (CD163) (brown). Panel b is a ×630 magnification of the region outlined in panel a. Panels d and f are ×400 magnifications of the regions outlined in panels c and e, respectively. (Panels 6c and d are republished from reference 31 with permission of the publisher.)

