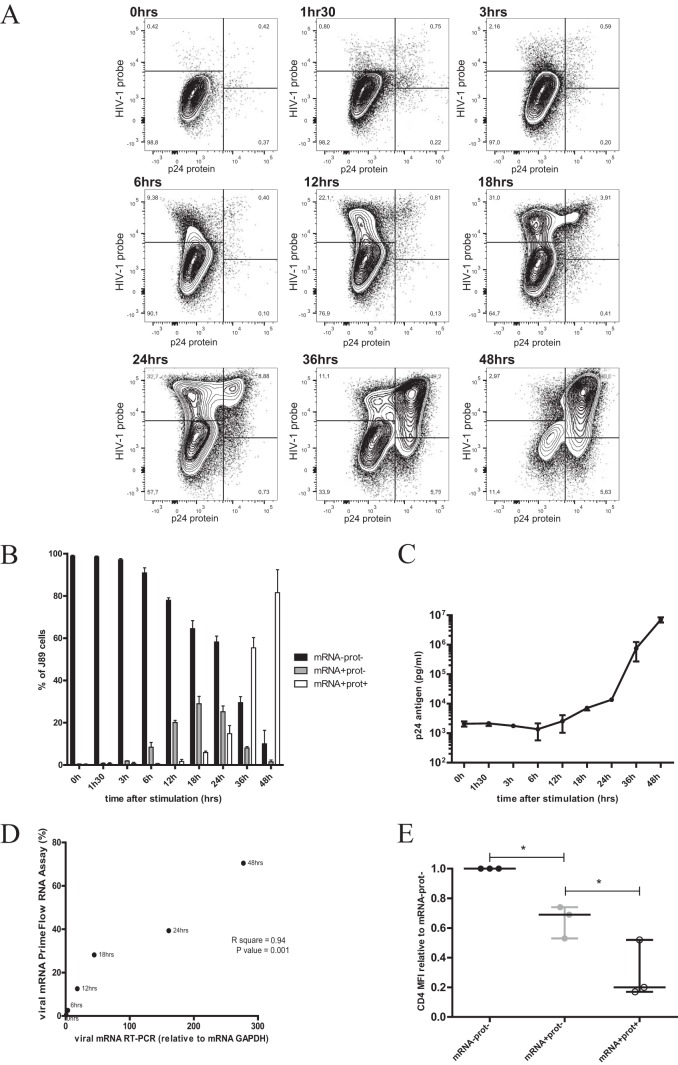
FIG 2.
hTNF-α stimulation of J89 cells. J89 cells were activated with hTNF-α (10 ng/ml) at time points ranging from 1 h 30 min to 48 h. A PrimeFlow RNA assay was performed at the indicated time points following stimulation. (A) Representative data showing the kinetics of the viral mRNA-single-positive population, the viral mRNA/protein-double-positive population, and the viral protein-single-positive population. (B) Data from three independent replicates show that the double-negative population decreased over stimulation time, while at 3 h, the viral mRNA single-positive population started to be detectable, reaching its peak at 18 h poststimulation and decreasing to almost undetectable levels by 48 h poststimulation. The viral mRNA/protein-double-positive population was first detectable at 12 h poststimulation and increased up to maximum levels of 80% (as a median) at 48 h poststimulation. (C) Measurement of p24 antigen levels in stimulated J89 cell supernatants with a p24 ELISA (Bio-Rad). Unstimulated cells were used as a background control (0 h). Experiments were performed in triplicates, and the horizontal bars are representative of medians ± standard deviations. (D) Parallel measurement of viral mRNA levels by real-time PCR and a PrimeFlow RNA assay on stimulated J89 cells at the indicated time points showed a statistically significant correlation (R2 = 0.94; P < 0.005). (E) CD4 expression in J89 cells was measured at 24 h poststimulation (n = 3), after hTNF-α treatment (10 ng/ml). Data evaluated with a Wilcoxon signed-rank test indicated that CD4 levels were already downregulated at the viral mRNA+ stage (P < 0.05), and CD4 downregulation increased with increasing viral protein production (P < 0.05).

