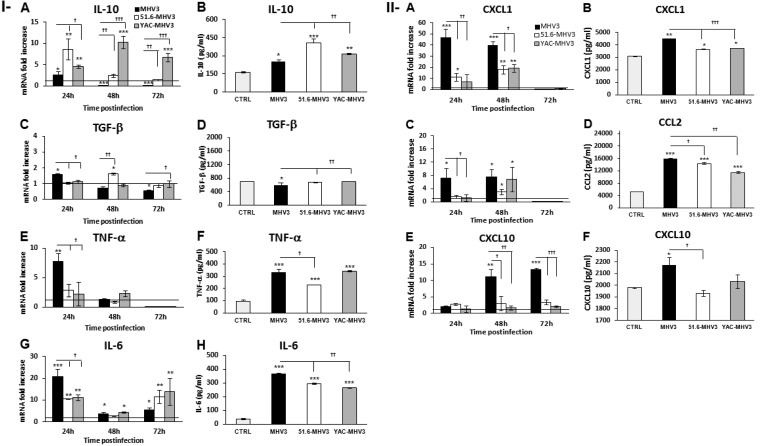
FIG 8.
Gene expression and production of IL-10, TGF-β, IL-6, TNF-α, CXCL1, CCL2, and CXCL10 in in vitro MHV3-, 51.6-MHV3-, and YAC-MHV3-infected LSECs. LSECs were infected at an MOI of 0.1 with MHV3, 51.6-MHV3, and YAC-MHV3, and RNA and supernatant from LSECs infected with each viral strain were collected at 24, 48, or 72 h p.i. (I) Fold changes in IL-10 (A), TGF-β (C), IL-6 (E), and TNF-α (G) mRNA were analyzed by qRT-PCR. Values represent fold change in gene expression relative to that in uninfected LSECs (control arbitrarily taken as 1) after normalization to HPRT expression. All samples were run in duplicate. Production levels of IL-10 (B), TGF-β (D), IL-6 (F), and TNF-α (H) in supernatants were quantified by ELISA at 24 h p.i. (II) Fold changes in CXCL1 (A), CCL2 (C), and CXCL10 (E) mRNA were analyzed by qRT-PCR. Values represent fold change in gene expression relative to that in control (uninfected) LSECs after normalization to HPRT expression. All samples were run in duplicate. Production levels of CXCL1 (B), CCL2 (D), and CXCL10 (F) in supernatants were quantified by ELISA at 24 h p.i. All experiments were conducted in duplicate, and results are representative of two independent experiments. Values are means and standard errors of the means. *, P < 0.05; **, P < 0.01; ***, P < 0.001 (compared with mock-infected cells). †, P < 0.05; ††, P < 0.01; †††, P < 0.001 (compared with MHV3-infected cells).

