
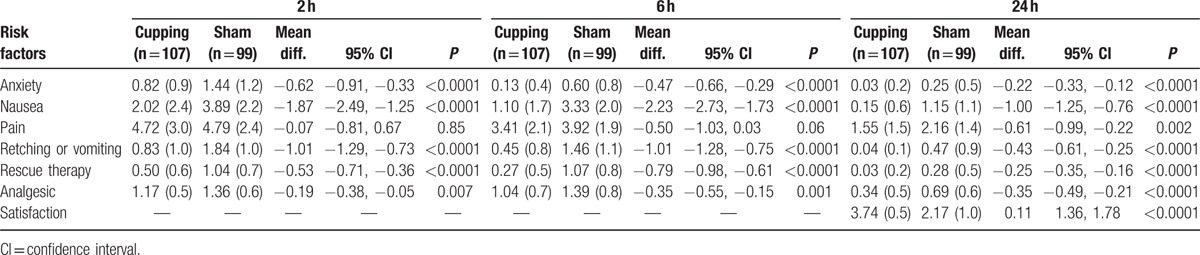
Table 2.
Means (standard deviations), mean difference, 95% CI, and P value for intervention and control groups and comparing both groups (2-tailed tests).
Official websites use .gov
A
.gov website belongs to an official
government organization in the United States.
Secure .gov websites use HTTPS
A lock (
) or https:// means you've safely
connected to the .gov website. Share sensitive
information only on official, secure websites.
Means (standard deviations), mean difference, 95% CI, and P value for intervention and control groups and comparing both groups (2-tailed tests).