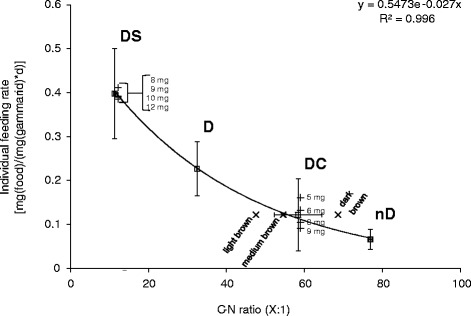
Figure 4.

Variation in feeding rate of individual Gammarus pulex with the C-N ratio of food eaten. Average values (± standard deviation) are plotted for the four food sources tested (white square; D, DC, DS and nD), and for the food sources DS and DC, the feeding rate is additionally plotted in dependence of the body weight (dw) of the test organisms (+). The C-N ratio for the food source DC was also determined after classification into three groups of leaf colour (X).
