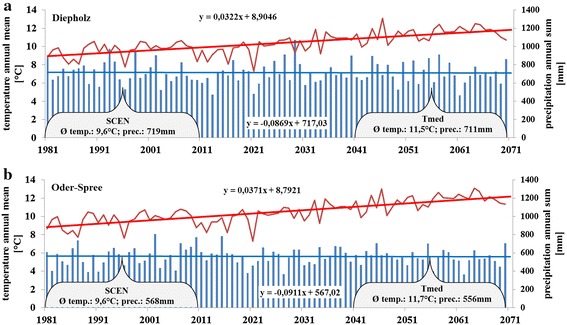
Fig. 2.

Mean annual temperature (temp.) and sum of annual precipitation (prec.) of both study areas Diepholz (a top) and Oder-Spree (b bottom). Mean temperature and precipitation during the investigation period SCEN (1981–2010) as well as T med (2041–2070) is given
