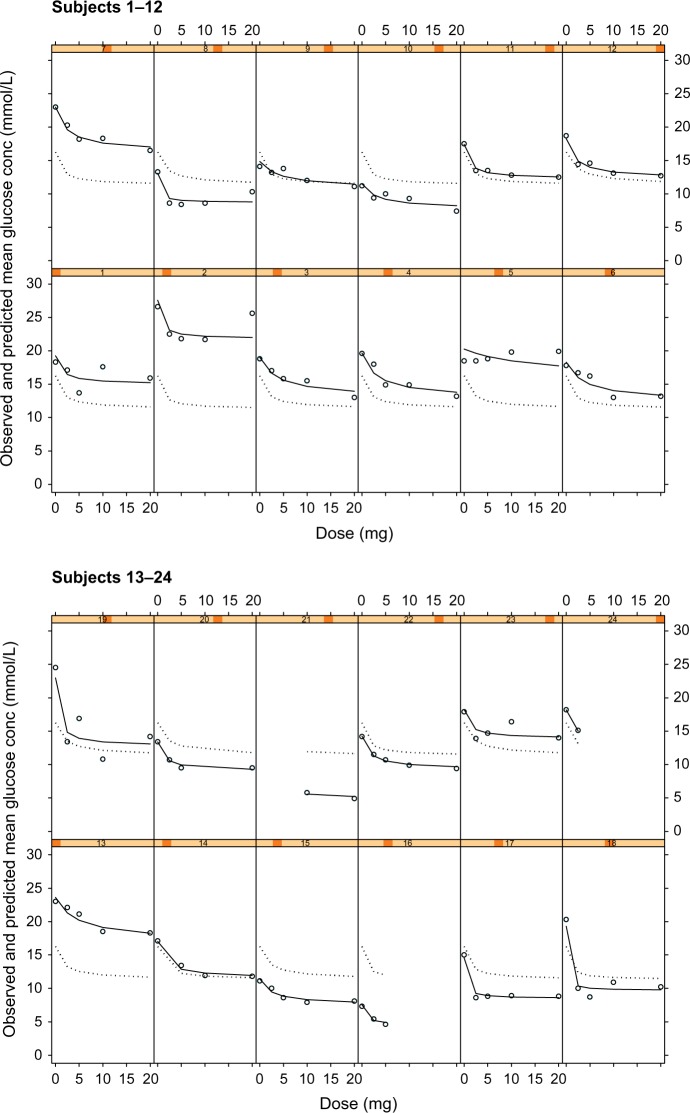
Figure 3.
Plots of observed glucose concentrations (open circles), population model predictions (dotted line), and individual model predictions (solid line) for the steady state concentration (Cpss)-mean glucose concentration PKPD model for glucose response to glibenclamide.
Notes: Each cell represents the data for an individual subject shown as a dose–response plot, ie, y-axis shows fasting glucose concentration in mmol/L and x-axis shows dose in mg.
Abbreviation: PKPD, pharmacokinetic/pharmacodynamic.

