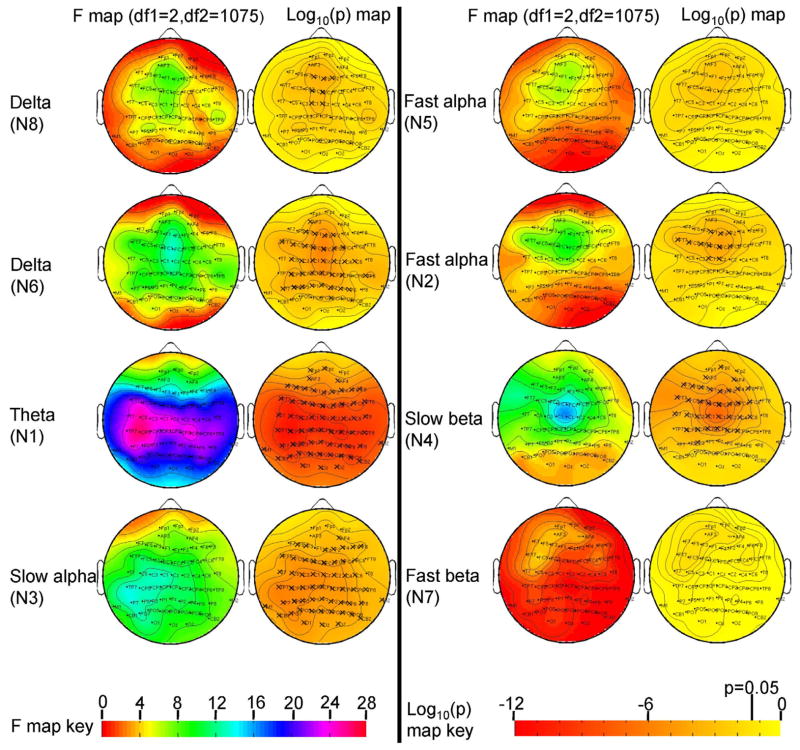
Figure 2.
F-maps and significance levels from the omnibus analysis of covariance test comparing spatial weights from GICA across three groups.
The three groups comprised schizophrenia and psychotic bipolar disorder probands (n=459) their relatives (n=432) and healthy controls (n=200). ‘X’ indicates significant after Bonferroni correction for 64 leads (p=0.05/64).

