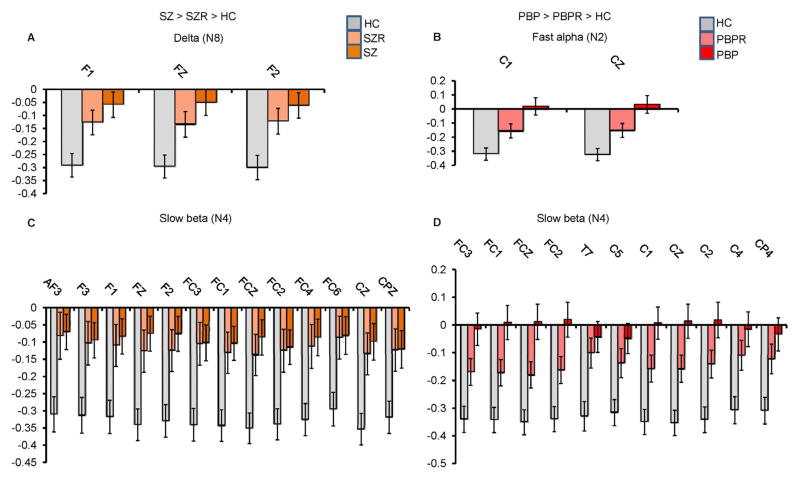
Figure 5.
Mean spatial weights of clinically relevant leads significantly differing between healthy controls and both probands and relatives.
(A) Increased delta (N8) activity in schizophrenia (SZ) probands (n=225) and their relatives (SZR) (n=201) compared to healthy controls (HC) (n=200), (B) augmented fast alpha (N2) activity in psychotic bipolar disorder (PBP) probands (n=234) and their relatives (PBPR) (n=231) vs HC (n=200), (C) increased slow beta (N4) in SZ and SZR compared to HC and (D) increased slow beta (N4) in PBP and PBPR compared to HC. All the displayed leads were significantly different between HC and both probands and relatives after Bonferroni correction for pairwise comparison (p=0.05/5). Error bars represent SEM.

