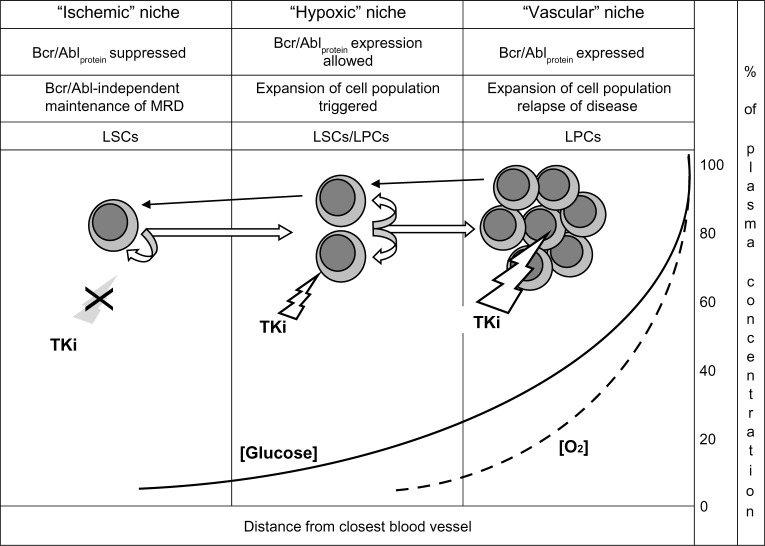
Figure 2.
Nutrient supply and niche homing of functional stem and progenitor cell subsets in chronic myeloid leukemia. Straight white arrows: hierarchical top-down phenotype shift (describing biology of disease from onset to clinical level). Curved arrows: self-renewal. Black arrows: environment-enforced bottom-up phenotype shift (according to the chiaroscuro model). Solid and dashed lines: decay of glucose concentration or oxygen tension, respectively (expressed as percentage of value within blood vessel), in function of distance from the closest source of blood supply and of the definition of individual niche types. White bolt: TKi effective. Grey bolt/X: TKi ineffective. Note the different sensitivity of cell subsets to TKi treatment in relation to Bcr/Abl protein expression.
Abbreviations: MRD, minimal residual disease; LSCs, leukemia stem cells; LPCs, leukemia progenitor cells; TKi, tyrosine-kinase inhibitor.

