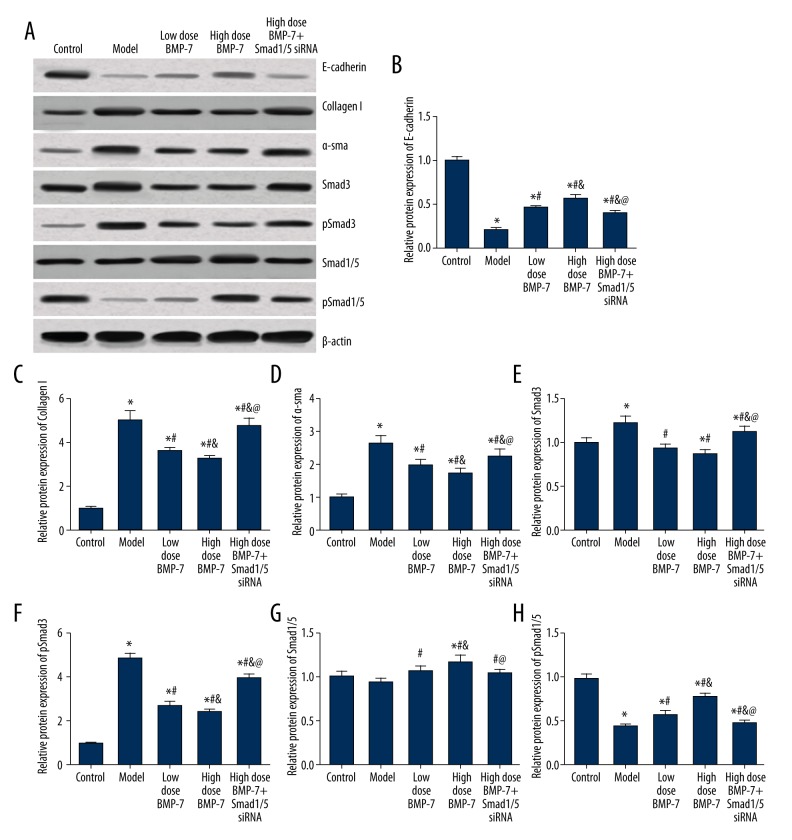
Figure 8.
Expression levels of fibrosis markers in mice with different treatments. (A) Western blot analysis of fibrosis markers in cardiac tissues of different groups normalized to β-actin. (B–H) Quantitative data protein level of fibrosis markers in tissues with different control. Data are presented as mean ±SD for 3 independent experiments. * P<0.05 versus control group; # P<0.05 versus model group; & P<0.05 versus model + medicine group; @ P<0.05 versus transfection control group.

