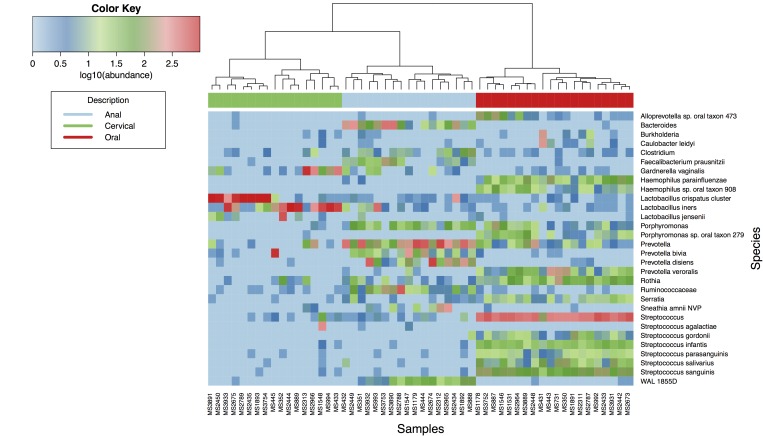
Figure 1.
Heatmap and hierarchical clustering showing the microbiotas of subjects sampled from three anatomical niches (anal, cervical, and oral). Each column represents a sample with the niche shown by the colored bar across the top. Each row represents an operational taxonomic unit; where possible, reads were assigned down to the level of species. When a higher order taxon is named, the quantity of reads attributed to it is all those that could be mapped to that particular taxonomic level and not lower, i.e., reads that did map to lower taxa are not counted in the row corresponding to the parent taxon. The cladogram shown at the top represents hierarchical clustering.

