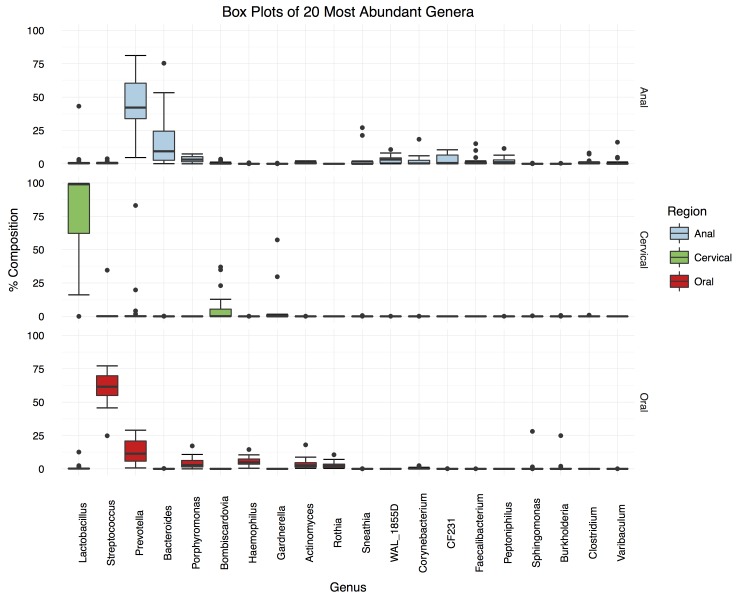
Figure 2.
Boxplots showing the distributions of proportions of the 20 most common genera observed at each anatomical niche across subjects. OTUs were condensed based on shared genus designation and plotted based on relative abundance within each niche. The genera were arranged in accordance to the sample sums across all niches to highlight the most prevalent representatives at each site. The median absolute deviation was used to estimate the error between samples and shown as box-and-whisker plots.

