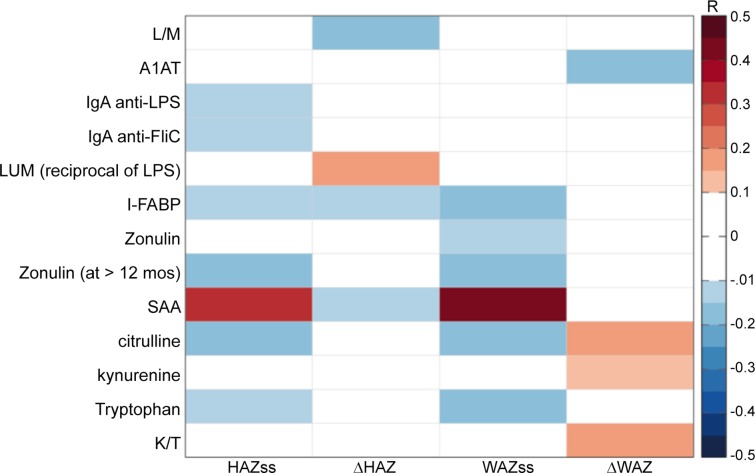
Fig 1. Heat map showing all significant partial Pearson correlations of barrier and systemic biomarkers with HAZ or WAZ at enrollment (ie. study start, ss) or with changes in (Δ) HAZ or WAZ.
Significant correlations (at p<0.05; * = p<0.01) between biomarkers and growth, controlling for child age and gender. HAZ = height for age Z score; WAZ = weight for age z score; ss = study start; Δ = change in HAZ or WAZ at 2-6m followup; numbers range from 230 to 292 except for zonulin at age >12m where n = 172. Full r, p and df values are provided in S1 Table.

