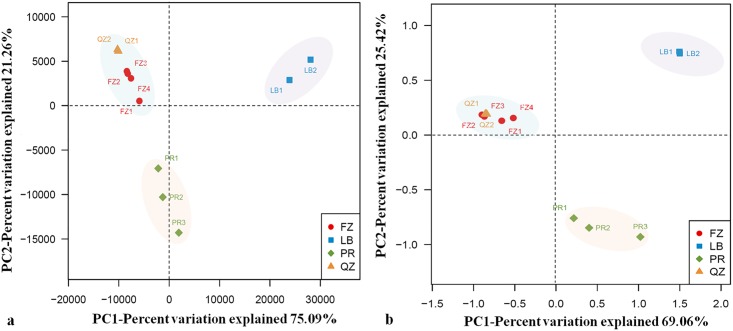
Fig 4. The plots of principal component analysis (PCA) (a) and principal coordinate analysis (PCoA) based on unweighted UniFrac distance metric (b).
Samples of CDTs were presented by different color-filled symbols. FZ1-4, four samples of Fuzhuan brick tea; QZ1-2, two samples of Qingzhuan brick tea; PR1-3, three samples of Pu’er tea; LB1-2, two samples of Liubao tea.

