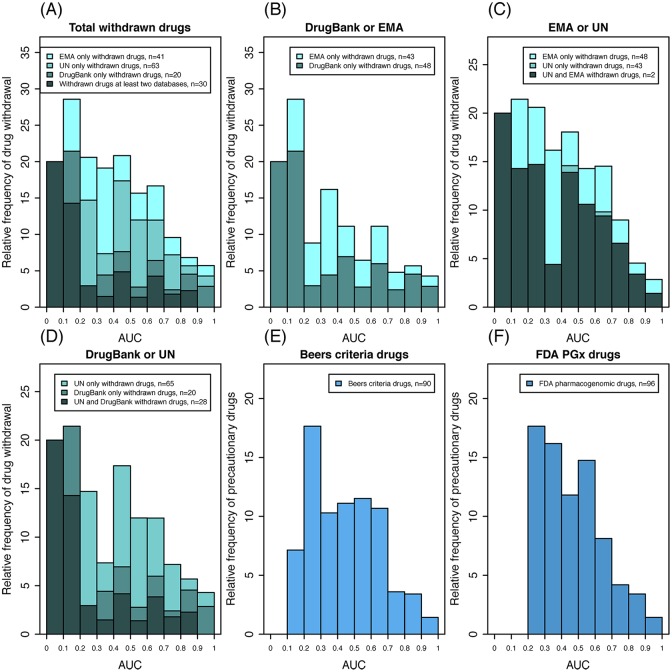
Fig 4. Frequency distribution of drug withdrawals and precautions according to population deleteriousness scores.
The relative frequency of drug withdrawals was obtained for each of the 10 AUC score bins of equal sizes. (A) All three resources; (B–D) paired resources. Drugs with lower AUC values were more frequently withdrawn from the market (see Table 1). Relative frequencies of drug precautions according to the Beers criteria (E) and US FDA pharmacogenomics labels (F) were significantly higher in lower AUC score bins compared to higher AUC score bins (P < 0.01, Cochran-Armitage Trend test; see Table 1). AUC, area under the drug deleteriousness score curve; EMA, European Medicines Agency; UN, United Nations.

