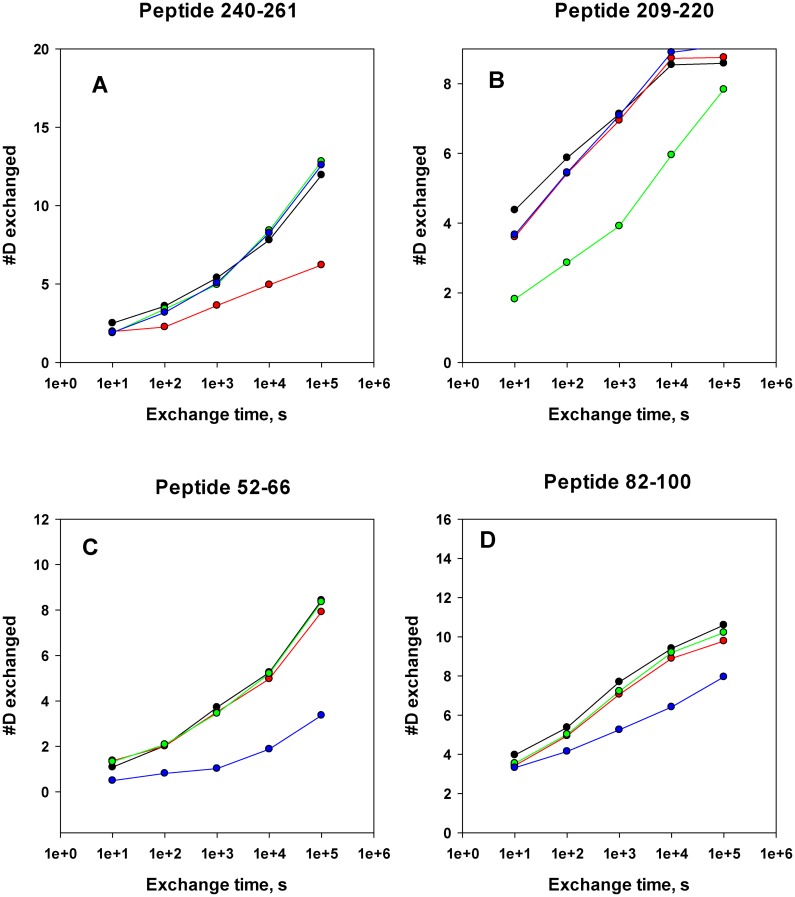
Fig 3. Typical deuterium accumulation plots used to identify monoclonal antibody binding epitopes on MntC.
Black symbols and lines—MntC alone, red symbols and lines—deuterium accumulation on MntC in the presence of mAB 305-78-7, green symbols and lines—deuterium accumulation on MntC in the presence of mAB 305-101-8, blue symbols and lines—deuterium accumulation on MntC in the presence of mAB 305-72-5. Peptide 240–261 (panel A) includes residues recognized by mAB 305-78-7, peptide 209–220 (panel B) includes major part of the mAB 305-101-8 epitope, peptides 52–66 and 82–100 (panels C and D) include residues recognized by mAB 305-72-5. The plots are scaled to the maximum number of deuterons that can exchange onto a given peptide. Deuterium accumulation plots for the corresponding peptides from all of the experiments are shown on every panel for comparison.

