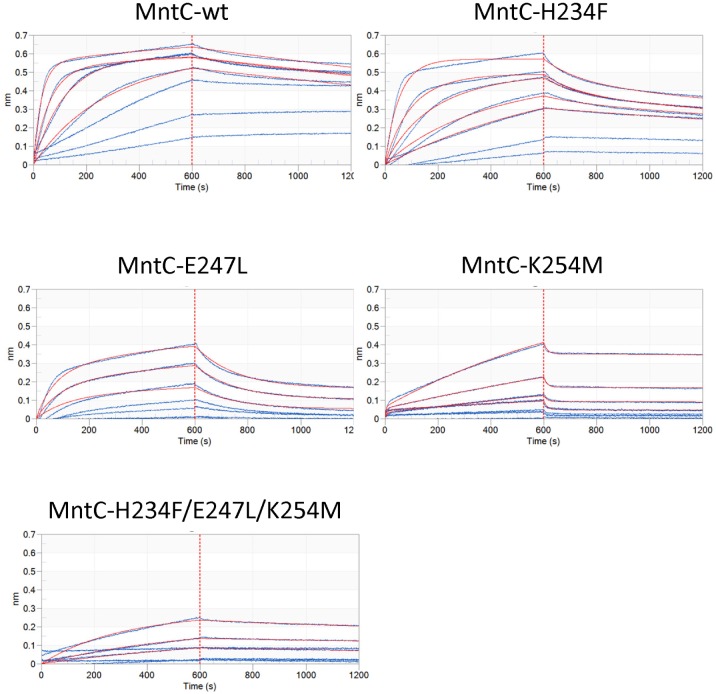
Fig 8. Bio-Layer Interferometry characterization of mAB 305-78-7 binding to MntC variants.
Y-axes—magnitude of the interference patterns shifts in nanometers, X-axes—experiment time in seconds. 0 to 600 s—association phase of the experiment, 601–1200 s—dissociation phase of the experiment (separated from the association phase by dashed red lines for clarity). Blue lines—experimental traces of individual antigen concentrations, red lines—fitting results.

