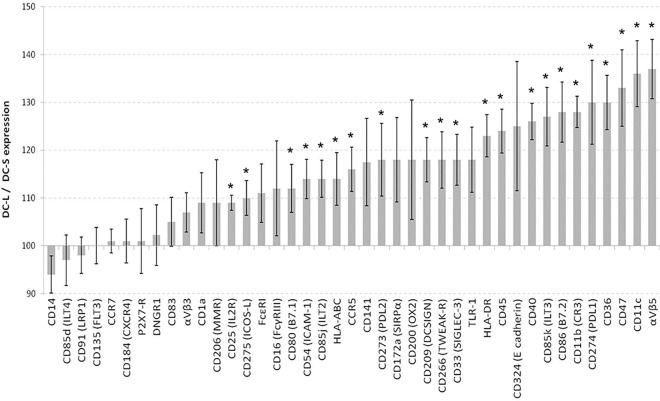
Fig 2. Expression of surface markers on immature DC-L vs DC-S.
The relative surface marker expression of DC-L vs DC-S at the immature stage is shown. DC-S median fluorescence intensity (MFI) was normalized to 100; values above and below 100 indicate higher and lower expression, respectively, of DC-L as compared to DC-S. * = p<0.05 for the DC-L / DC-S MFI ratio. n ≥ 3 for all markers. Only SB- or PI-negative cells are shown. Error bars = ±SEM. We also tested CCR2, CD1e, CD121b (IL1R2), CD163, HLA-G, LOX-1 (OLR1), OX40-L (CD252), RAGE, TIM-1, and TSLP-R; however, these surface markers were expressed at very low levels, precluding accurate quantification, or not expressed at all, thus, they are not shown.

