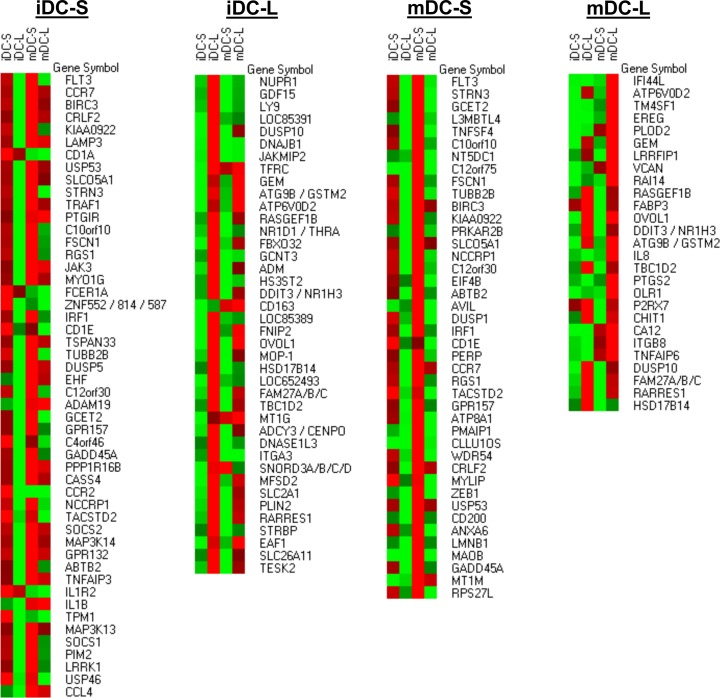
Fig 4. Characterization of differentially expressed transcripts in DC-S and DC-L.
iDCs were sorted into DC-S and DC-L and replated for 24 hours with or without LPS, followed by RNA extraction. A pool of 3 experiments was analyzed using Affymetrix microarrays. Four pooled RNA datasets were obtained: DC-S at the immature stage and after LPS stimulation (iDC-S and mDC-S, respectively), and DC-L at the immature stage and after LPS stimulation (iDC-L and mDC-L, respectively). The data was preprocessed using RMA and a cutoff of 4 (log). In order to obtain the list of differentially expressed genes, the expression profiles of DC-S and DC-L were subtracted from each other. The list of genes presented in each category (iDC-S, iDC-L, mDC-S and mDC-L) represents genes that were differentially expressed, defined as a transcript with at least a twofold difference; thus, a gene that is present at similar levels in both subsets would be excluded from the results, even if highly expressed. Due to the cutoff used, fold changes indicate minimal overexpression (the differences can be larger but not smaller). A heatmap representation of the transcripts is shown at absolute levels after RMA and cutoff, in comparison to all the other samples. Red indicates high expression; green, low. Values were row-normalized; shown from top to bottom, from highest to lowest overexpression.

