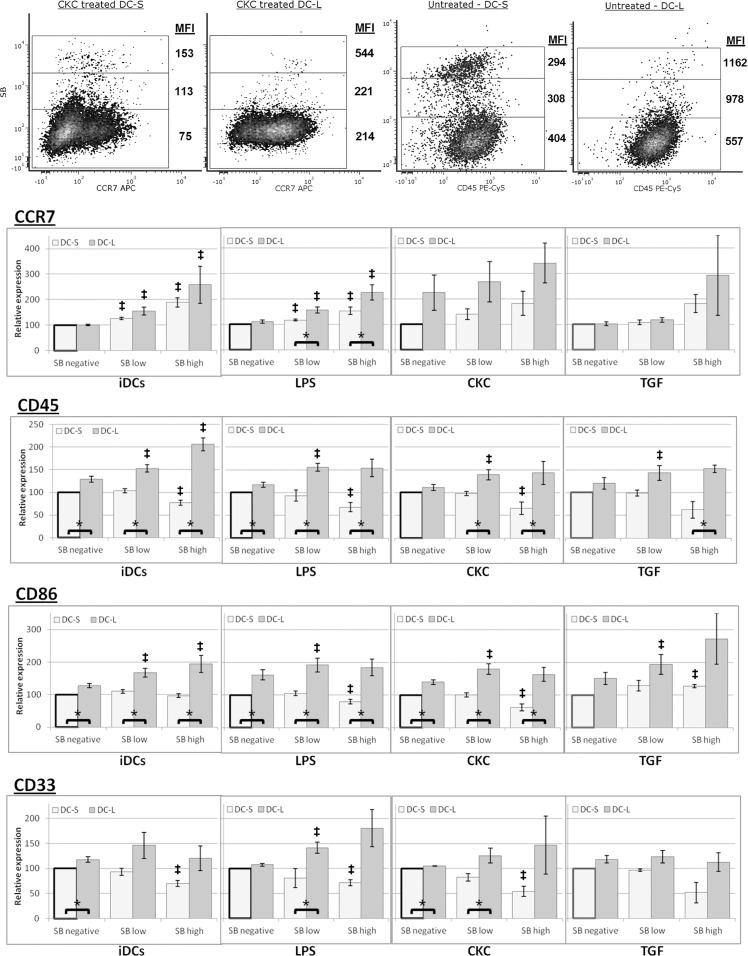
Fig 5. Patterns of surface marker expression changes upon spontaneous DC death.
DCs were labeled with fluorescent antibodies for marker expression and co-stained with SB. The cells were gated for DC-S and DC-L, as well as SB negative, low, and high, indicating advancing stages of spontaneous cell death during culture. Top Row: Density plots of representative examples are shown. The MFI of each marker is indicated beside the gates. All gates include at least 50 events. Bottom rows (bar charts): DCs at the immature stage and after stimulation with LPS, CKC, and TGF-β, as indicated, were co-stained with fluorescent antibodies and SB, and gated as described above. Values were normalized so that SB negative DC-S = 100 (bold outline). n≥3 for all markers. * = p<0.05 for the DC-L / DC-S MFI ratio. ‡ = p<0.05 for the DC-L / DC-S MFI ratio change vs SB negative (paired t-test). Error bars = ±SEM.

