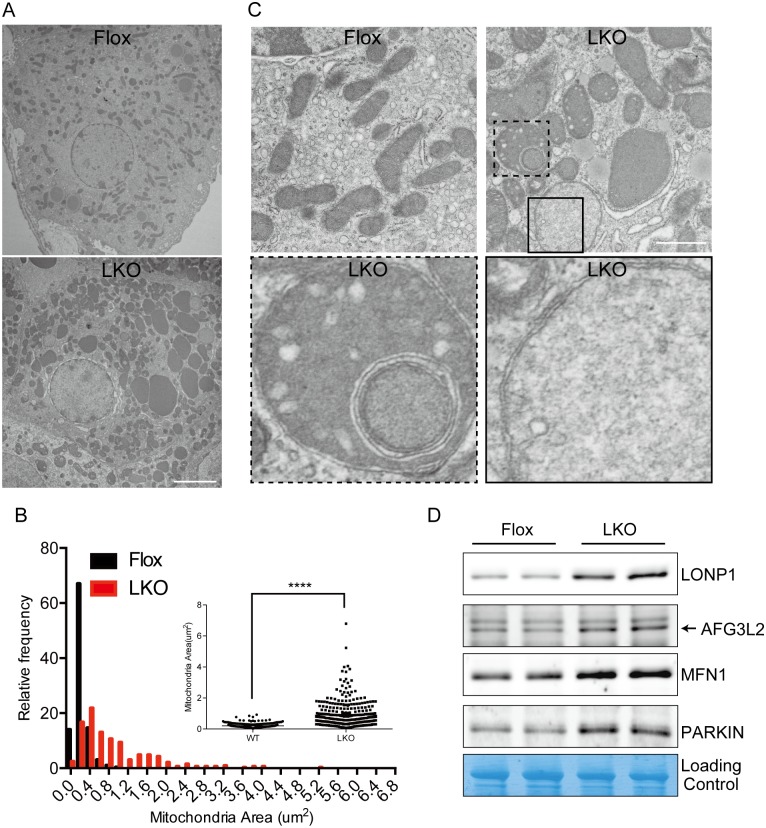
Fig 6. Aberrant mitochondrial morphology in Mtu1-deficient hepatocytes.
(A) Representative electron microscopy images of hepatocytes in control (Flox) and hepatocyte-specific Mtu1 knockout (LKO) mice. Bar = 5 μm. (B) The mitochondrial area in Flox and LKO hepatocytes was examined by histogram and scatter plot (Insert). n = 300 and 330 for Flox and LKO, respectively. ***P < 0.001. (C) Representative images of hepatic mitochondria at high magnification. Bar = 1 μm. Boxes with dashed and solid lines indicate aberrant structures magnified in lower panels. (D) Examination of the amounts of proteins related to mitochondrial proteostasis by western blotting. Total mitochondrial proteins were stained and used as a loading control. Arrow indicates bands corresponding to AFG3L2.

