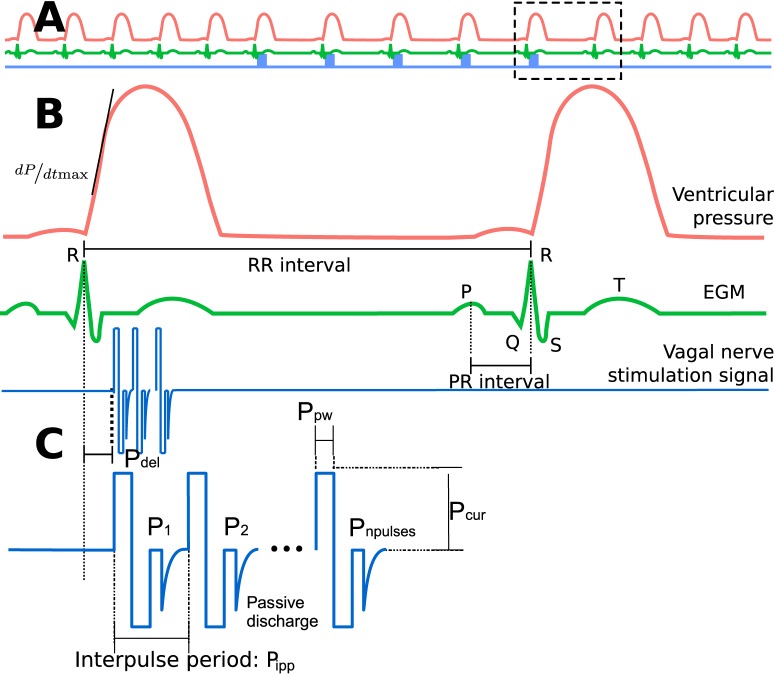
Fig 1. Diagram depicting the main signals and the VNS parameters analyzed in this paper.
A) Representation of the left ventricular pressure signal (red), electrogram (EGM, green) and Vagus Nerve Stimulation signal (blue). B) Zoom displaying the main markers extracted from each beat: the inter-beat interval (RR interval) representing the chronotropic effect, the interval between the P-wave and the R-wave (PR inteval) used as a marker of the dromotropic effect and the maximum of the first of the Plv signal (). C) A typical VNS burst delivered synchronously with a cardiac beat (after a given delay Pdel), showing the VNS parameters studied in this paper.

